5. Valence band maximum tutorial
5.1. Introduction
In this tutorial, you will see how to compute the valence band maximum of diamond. This VBM is obtained invoking Janak’s theorem
\(\frac{d E(n_i)}{dn_i} = e_i\)
where \(n_i\) is the occupation number of the highest occupied state \(i\) with the eigenvalue \(e_i\). This is calculated by finite difference, i.e. by removing a small fractional charge from the diamond unit cell.
\(e_i = \frac{E[Q=N] - E[Q=N-\delta N]}{\delta N}\)
where \(\delta N = 10^{-3}\) is usually a good value.
5.2. Write an input file template
We will perform 4 total energy calculations to obtain 3 VBM values. We
first write an input file template like scf_base.input. Note the
lines
info.savepath = './results/scf_fxfacx'
info.outfile = 'fscf_fxfacx.out'
atom.nvalence = 2 * 4 - 1 / xfacx
The tag xfacx will be replaced by the inverse fraction of removed
electrons. For example, setting the tag to 100 will set the valence
to 2 * 4 - 1 / 100 = 7.99, removing 0.01 electron. The first two
lines set the name of the result file and standard output log file
respectively.
5.3. Perform the calculations
As mentioned above, we will perform 4 total energy calculations. To
generate the 4 corresponding input files, one may run the script
genall.sh. The tag values are set to 10, 100, 1000, 10000. Our
template uses the pseudopotential file C_SZDP.mat which should be at
the root of the tutorials directory. One can perform the
calculations one by one, or run them in parallel using the script
runall.sh. Before using runall.sh, modify the script considering
that N is the number of simultaneous calculations and NCORE is
the total number of cores you want to use.
5.4. Determine the equilibrium volume
The last step is to extract the equilibrium volume from the equation of
states. This is done with the script read_vbm.m. It will list the
files that match the pattern results/scf_f*.mat, there should be 4
in total. Then it will compute the VBM values using finite differences.
Finally, it will print
vbm = 10.126067 eV
The smallest difference value is printed, but make sure that it is converged. This is readily seen on a plot of the VBM as a function of difference.
figure()
semilogx(x,vbm); hold on
xlabel('\Delta N')
ylabel('\Delta E / \Delta N (eV)')
saveas(gcf,'eos_vbm.png')
which gives
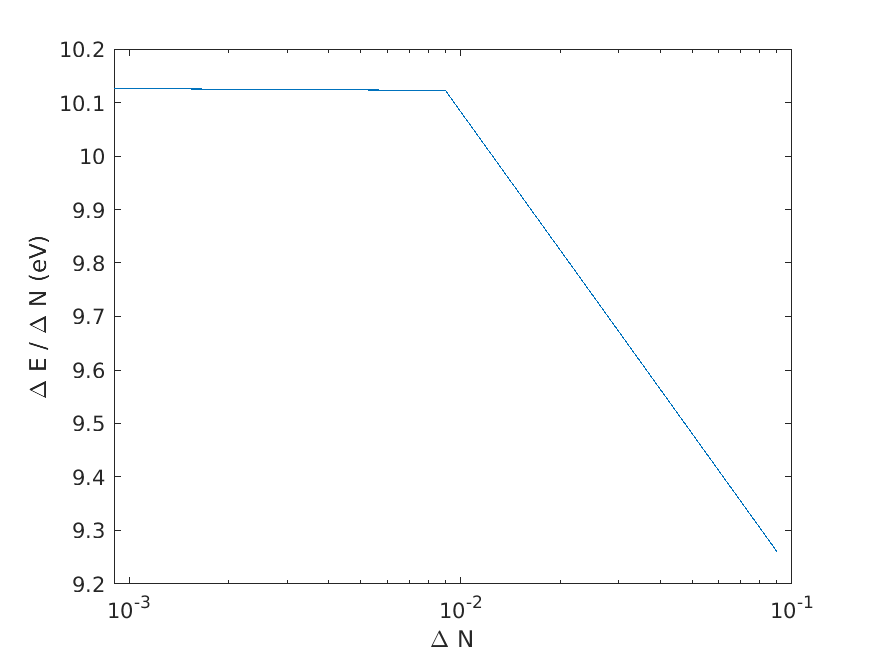
Fig. 5.4.1 VBM versus occupancy difference