Band structure tutorial
Requirements
Software components
nanotools
RESCU+
Pseudopotentials
I will need the following pseudopotentials.
Ga_AtomicData.mat
As_AtomicData.mat
Let’s copy them from the pseudo database to the current working directory and export RESCUPLUS_PSEUDO=$PWD.
Briefing
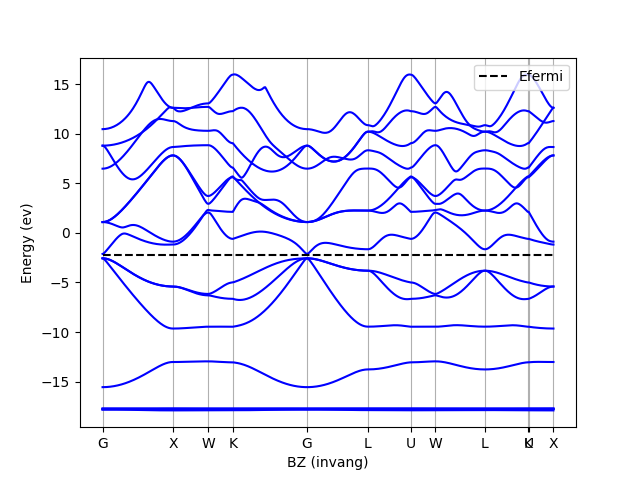
In this tutorial, I show how to calculate the band structure of the GaAs crystal.
Setup
Create the Python script etot.py with the following content (see the tutorial on TotalEnergy)
from nanotools import Atoms, Cell, System, TotalEnergy
a = 2.818
cell = Cell(avec=[[0.,a,a],[a,0.,a],[a,a,0.]], resolution=0.12)
fxyz = [[0.00,0.00,0.00],[0.25,0.25,0.25]]
atoms = Atoms(fractional_positions=fxyz, formula="GaAs")
sys = System(cell=cell, atoms=atoms)
calc = TotalEnergy(sys)
calc.solve()
and bs.py
from nanotools.bandstructure import BandStructure as BS
calc = BS.from_totalenergy("nano_scf_out.json")
calc.solve()
fig = calc.plot_bs(filename="gaas_bs.png") # plot results
Explanations
Here is a high level view of the calculation workflow:
Initialize the BS calculator from a ground state calculation (
TotalEnergy).Perform a band structure calculation (non-self-consistently).
Use
the BS calculator’s method to plot the band structure.
Initialize the BS calculator
Upon completing the total energy calculation, the results are saved in nano_scf_out.json.
I will initialize a BS calculator using the class method from_totalenergy.
calc = BS.from_totalenergy("nano_scf_out.json")
The method from_totalenergy will copy the system information and initialize the BS calculator.
The k-point path is automatically generated from the cell shape.
It can be changed using the system.set_kpoint_path method, for example
calc.system.set_kpoint_path(special_points=["L","G","X"])
Band structure calculation
RESCU+’s solvers are invoked calling the solve method
calc.solve()
The method writes all parameters to a JSON file, then calls the relevant (Fortran) program, then loads the data back into the calculator.
The output of rescuplus goes to nano_bs_out.h5 and nano_bs_out.json.
Important data is stored in
calc.energy.eigenvalues, the Kohn-Sham eigenvalues.calc.system.kpoint.bvec, the reciprocal lattice vectors.calc.system.kpoint.fractional_coordinates, the k-point (fractional) coordinates.
Plot the band structure
I use the plot_bs method to plot the band structure.
fig = calc.plot_bs(filename="gaas_bs.png") # plot results
plot_bs is a function that returns a Pyplot figure handle.
You can use the handle to modify the figure or save it to a file.
You should see something similar to