Band unfolding tutorial
Requirements
Software components
nanotools
RESCU+
Pseudopotentials
I will need the following pseudopotentials.
Au_AtomicData.mat
Cu_AtomicData.mat
Let’s copy them from the pseudo database to the current working directory and export RESCUPLUS_PSEUDO=$PWD.
References
Chen, M., & Weinert, M. (2018). Layer k-projection and unfolding electronic bands at interfaces. Physical Review B, 98(24), 245421.
Ku, W., Berlijn, T., & Lee, C.-C. (2010). Unfolding First-Principles Band Structures. Physical Review Letters, 104(21), 216401.
Briefing
In this tutorial, I show how to unfold the band structure of a copper supercell with a gold defect onto a copper primitive cell.
Setup
Create the Python script etot.py with the following content (see the tutorial on TotalEnergy)
from nanotools import Atoms, Cell, System, TotalEnergy
import numpy as np
a = 3.74
cell = Cell(avec=a*np.eye(3), resolution=0.12)
fxyz = [[0.0, 0.0, 0.0],[0.0, 0.5, 0.5],[0.5, 0.0, 0.5],[0.5, 0.5, 0.0]]
atoms = Atoms(fractional_positions=fxyz, formula="AuCu(3)")
sys = System(cell=cell, atoms=atoms)
sys.kpoint.set_grid([6,6,6])
calc = TotalEnergy(sys)
calc.solve()
and bsu.py
from nanotools.bandunfolding import BandUnfolding as BU
import numpy as np
calc = BU.from_totalenergy("nano_scf_out.json")
calc.set_primitive_cell(avec=3.74/2.*(np.ones((3,3)) - np.eye(3)))
calc.set_kpoint_path(special_points=["L", "G", "X"])
calc.solve()
Explanations
Band structures are a useful analysis tool. Because of lattice mismatch, impurity concentration, disorder and other structural constraints, DFT calculations are routinely performed on supercells. This leads to so-called band folding which tends to obfuscate the band structure and make it difficult to analyse and compare to experimental results like ARPES data. Band unfolding is a way to recover a primitive-cell like band structure which is more readable.
The technique basically works as follows. The supercell band structure is calculated for a given path across the primitive cell band structure. The eigenstates of the supercells can be partitioned in k-space into several primitive cell states with different crystal momenta. In a perfect crystal, these states are normalized with respect to a reciprocal space cell such that their integral is 1. In general, integration over the reciprocal space cell yields a factor between 0 and 1, yielding a spectral function \(A(\mathbf{k}, \epsilon)\). In other words, instead of having pure Bloch states with definite energies, we obtain a band structure where each Block states has a weight.
Here is a high level view of the calculation workflow:
Initialize the BandUnfolding calculator from a ground state calculation (
TotalEnergy).Perform a band unfolding calculation (non-self-consistently).
Use
the BandUnfolding calculator’s method to plot the band spectral function.
Initialize the BandUnfolding calculator
Upon completing the total energy calculation, the results are saved in nano_scf_out.json.
I will initialize a BandUnfolding calculator using the class method from_totalenergy.
calc = BU.from_totalenergy("nano_scf_out.json")
calc.set_primitive_cell(avec=3.74/2.*(np.ones((3,3)) - np.eye(3)))
The method from_totalenergy will copy the system information and initialize the BU calculator.
I need to specify which cell I would like to unfold to.
This is typically a primitive cell commensurate with the supercell, but it could also be a smaller supercell.
Here, I’m using a face-centered cubic cell with lattice parameter 3.74 ang.
Note that this is not the equilibrium lattice constant of copper, but that of AuCu\(_3\) such that the primitive cell is commensurate with the supercell.
The k-point path is automatically generated from the cell shape.
It can be changed using the system.set_kpoint_path method, for example
calc.system.set_kpoint_path(special_points=["L","G","X"])
Band unfolding calculation
RESCU+’s solvers are invoked calling the solve method
calc.solve()
The method writes all parameters to a JSON file, then calls the relevant (Fortran) program, then loads the data back into the calculator.
The output of rescuplusu goes to nano_bsu_out.h5 and nano_bsu_out.json.
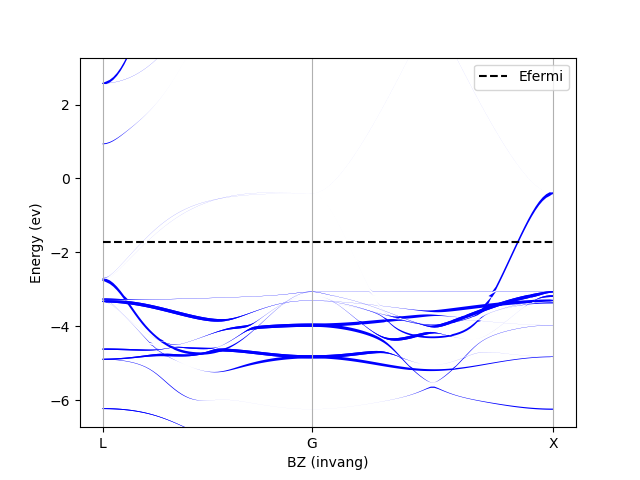
Plot the spectral function
I use the plot_spectral_function method to plot the spectral function.
from nanotools.bandunfolding import BandUnfolding as BU
calc = BU.read("nano_bsu_out.json")
calc.plot_spectral_function(filename="AuCu3_bsu.png", show=False)
plot_spectral_function is a function that returns a Pyplot figure handle.
You can use the handle to modify the figure or save it to a file.
You should see something similar to