Density of states tutorial
Requirements
Software components
nanotools
RESCU+
Pseudopotentials
I will need the following pseudopotentials.
Ga_AtomicData.mat
As_AtomicData.mat
Let’s copy them from the pseudo database to the current working directory and export RESCUPLUS_PSEUDO=$PWD.
References
Briefing
In this tutorial, I show how to calculate the density of states of the GaAs crystal.
Setup
Create the Python script etot.py with the following content (see the tutorial on TotalEnergy)
from nanotools import Atoms, Cell, System, TotalEnergy
a = 2.818
cell = Cell(avec=[[0.,a,a],[a,0.,a],[a,a,0.]], resolution=0.12)
fxyz = [[0.00,0.00,0.00],[0.25,0.25,0.25]]
atoms = Atoms(fractional_positions=fxyz, formula="GaAs")
sys = System(cell=cell, atoms=atoms)
calc = TotalEnergy(sys)
calc.solve()
and dos.py
from nanotools import DensityOfStates as DOS
calc = DOS.from_totalenergy("nano_scf_out.json")
calc.system.kpoint.set_grid([10,10,10])
calc.system.pop.set_type("tm")
calc.solve()
fig = calc.plot_dos(filename="gaas_dos.png")
Explanations
Here is a high level view of the calculation workflow:
Initialize the DOS calculator from a ground state calculation (
TotalEnergy).Perform a density of states calculation (non-self-consistently) on a finer k-point grid and compute the density of states (and optionally the projected density of states).
Use
the DOS calculator’s method to plot the density of states.
Initialize the DOS calculator
Upon completing the total energy calculation, the results are saved in nano_scf_out.json.
I will initialize a DOS calculator using the class method from_totalenergy.
calc = DOS.from_totalenergy("nano_scf_out.json")
calc.system.kpoint.set_grid([10,10,10])
calc.system.pop.set_type("tm")
The method from_totalenergy will copy the system information and initialize the DOS calculator.
I then increase the k-sampling resetting the kpoint grid with set_grid.
Finally, I change the population function (or smearing) from the default Gaussian to tm which stands for tetrahedron method.
Density of states calculation
RESCU+’s solvers are invoked calling the solve method
calc.solve()
The method writes all parameters to a JSON file, then calls the relevant (Fortran) program, then loads the data back into the calculator.
The output of rescuplus goes to nano_dos_out.h5 and nano_dos_out.json.
Important data is stored in
calc.dos.energy, the energies at which the DOS is calculated.calc.dos.dos, the DOS.
Plot the density of states
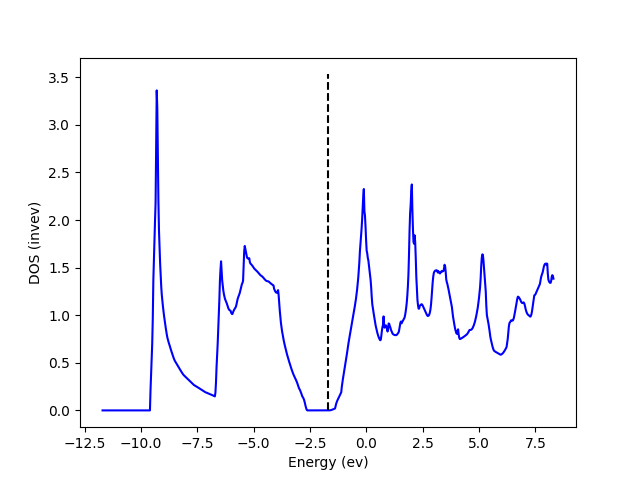
I call the plot_dos method to plot the density of states.
fig = calc.plot_dos(filename="gaas_dos.png")
plot_dos is a function that returns a Pyplot figure handle.
You can use the handle to modify the figure or save it to a file.
You should see something similar to
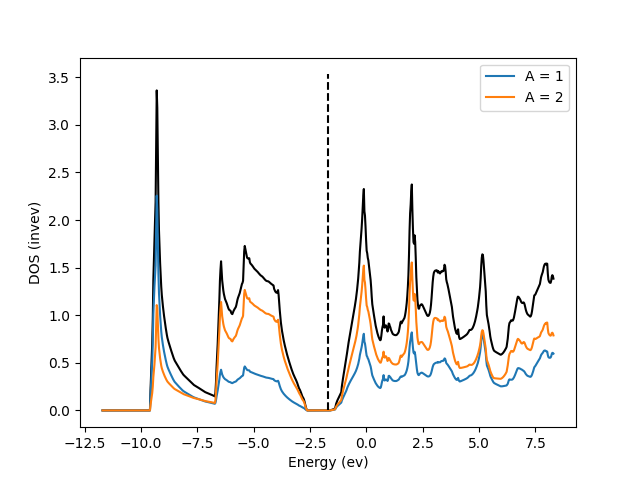
Partial density of states
The partial density of states is a very useful analysis tool.
To compute the partial density of states, one must set dos.pdos_return to True and then call solve.
calc.dos.pdos_return = True
calc.solve()
fig = calc.plot_pdos(sumA=[0,1], filename="gaas_pdos.png")
Upon exit, rescuplus will save the fully decomposed DOS to nano_dos_out.h5.
The partial DOS can be visualized with plot_pdos which has the optional arguments:
sumA Plot the density of states for specific atoms, as given by
sumA. For example,plot_pdos(sumA=[0,1])will plot the partial density of states of atom 1 and 2.sumL Plot the density of states for specific orbital angular momentum, as given by
sumL. For example,plot_pdos(sumL=[0])will plot the partial density of states of s-orbitals.sumM Plot the density of states for specific z-orbital angular momentum, as given by
sumM. For example,plot_pdos(sumM=[0])will plot the partial density of states of (z=0)-orbitals.
If several sum-parameters are specified, plot_pdos will plot all combinations of the parameters.
For instance, if one wishes to plot the partial density of states of \(p_z\)-orbitals, he may type
fig = calc.dos.plot_pdos(sumL=[1],sumM=[0])
Let’s now take a look at the partial density of states of each atom in GaAs
fig = calc.dos.plot_pdos(sumA=[0,1])
You should see