3. Your first project
Let’s run a real calculation end to end. We’ll compute the band structure and density of states of silicon — the same example used in Silicon: SCF, band structure & DOS, but here we focus on the experience of driving LatticeMind for the first time.
Before you begin
You need LatticeMind installed with an API key (Connecting your AI model) and the LatticeMind license required at startup (The LatticeMind license). To execute this calculation you also need the RESCU executable and a RESCU license. Without them, you can still plan, generate, validate, and inspect the inputs safely.
3.1. Step 1 — Start LatticeMind
Pick whichever interface you like (The three interfaces). We’ll show the CLI; the Web UI is identical in spirit.
latticemind
3.2. Step 2 — Describe what you want
Type your request in plain language:
Do an SCF, band structure, and DOS calculation for silicon, and plot the
band structure and DOS.
LatticeMind plans the workflow, builds the silicon structure, chooses parameters, and renders the RESCU inputs — narrating each stage as it goes.
3.3. Step 3 — Look before you leap
This is the habit worth forming. Before running anything, inspect the plan:
/status            # the planned calculations and their state
/inputs            # the input decks LatticeMind generated
/launch-preview    # exactly what will run, plus a cost estimate
If anything looks off, just say so — “use an 8×8×8 k-grid”, “add a relaxation first” — and LatticeMind re-plans. You are always in control.
3.4. Step 4 — Run it
When you’re happy, enable execution and go:
/execute on
run it
LatticeMind runs the SCF, hands its converged density to the band-structure and DOS steps, and post-processes the results. In the Web UI, the Live run panel shows this happening in real time:
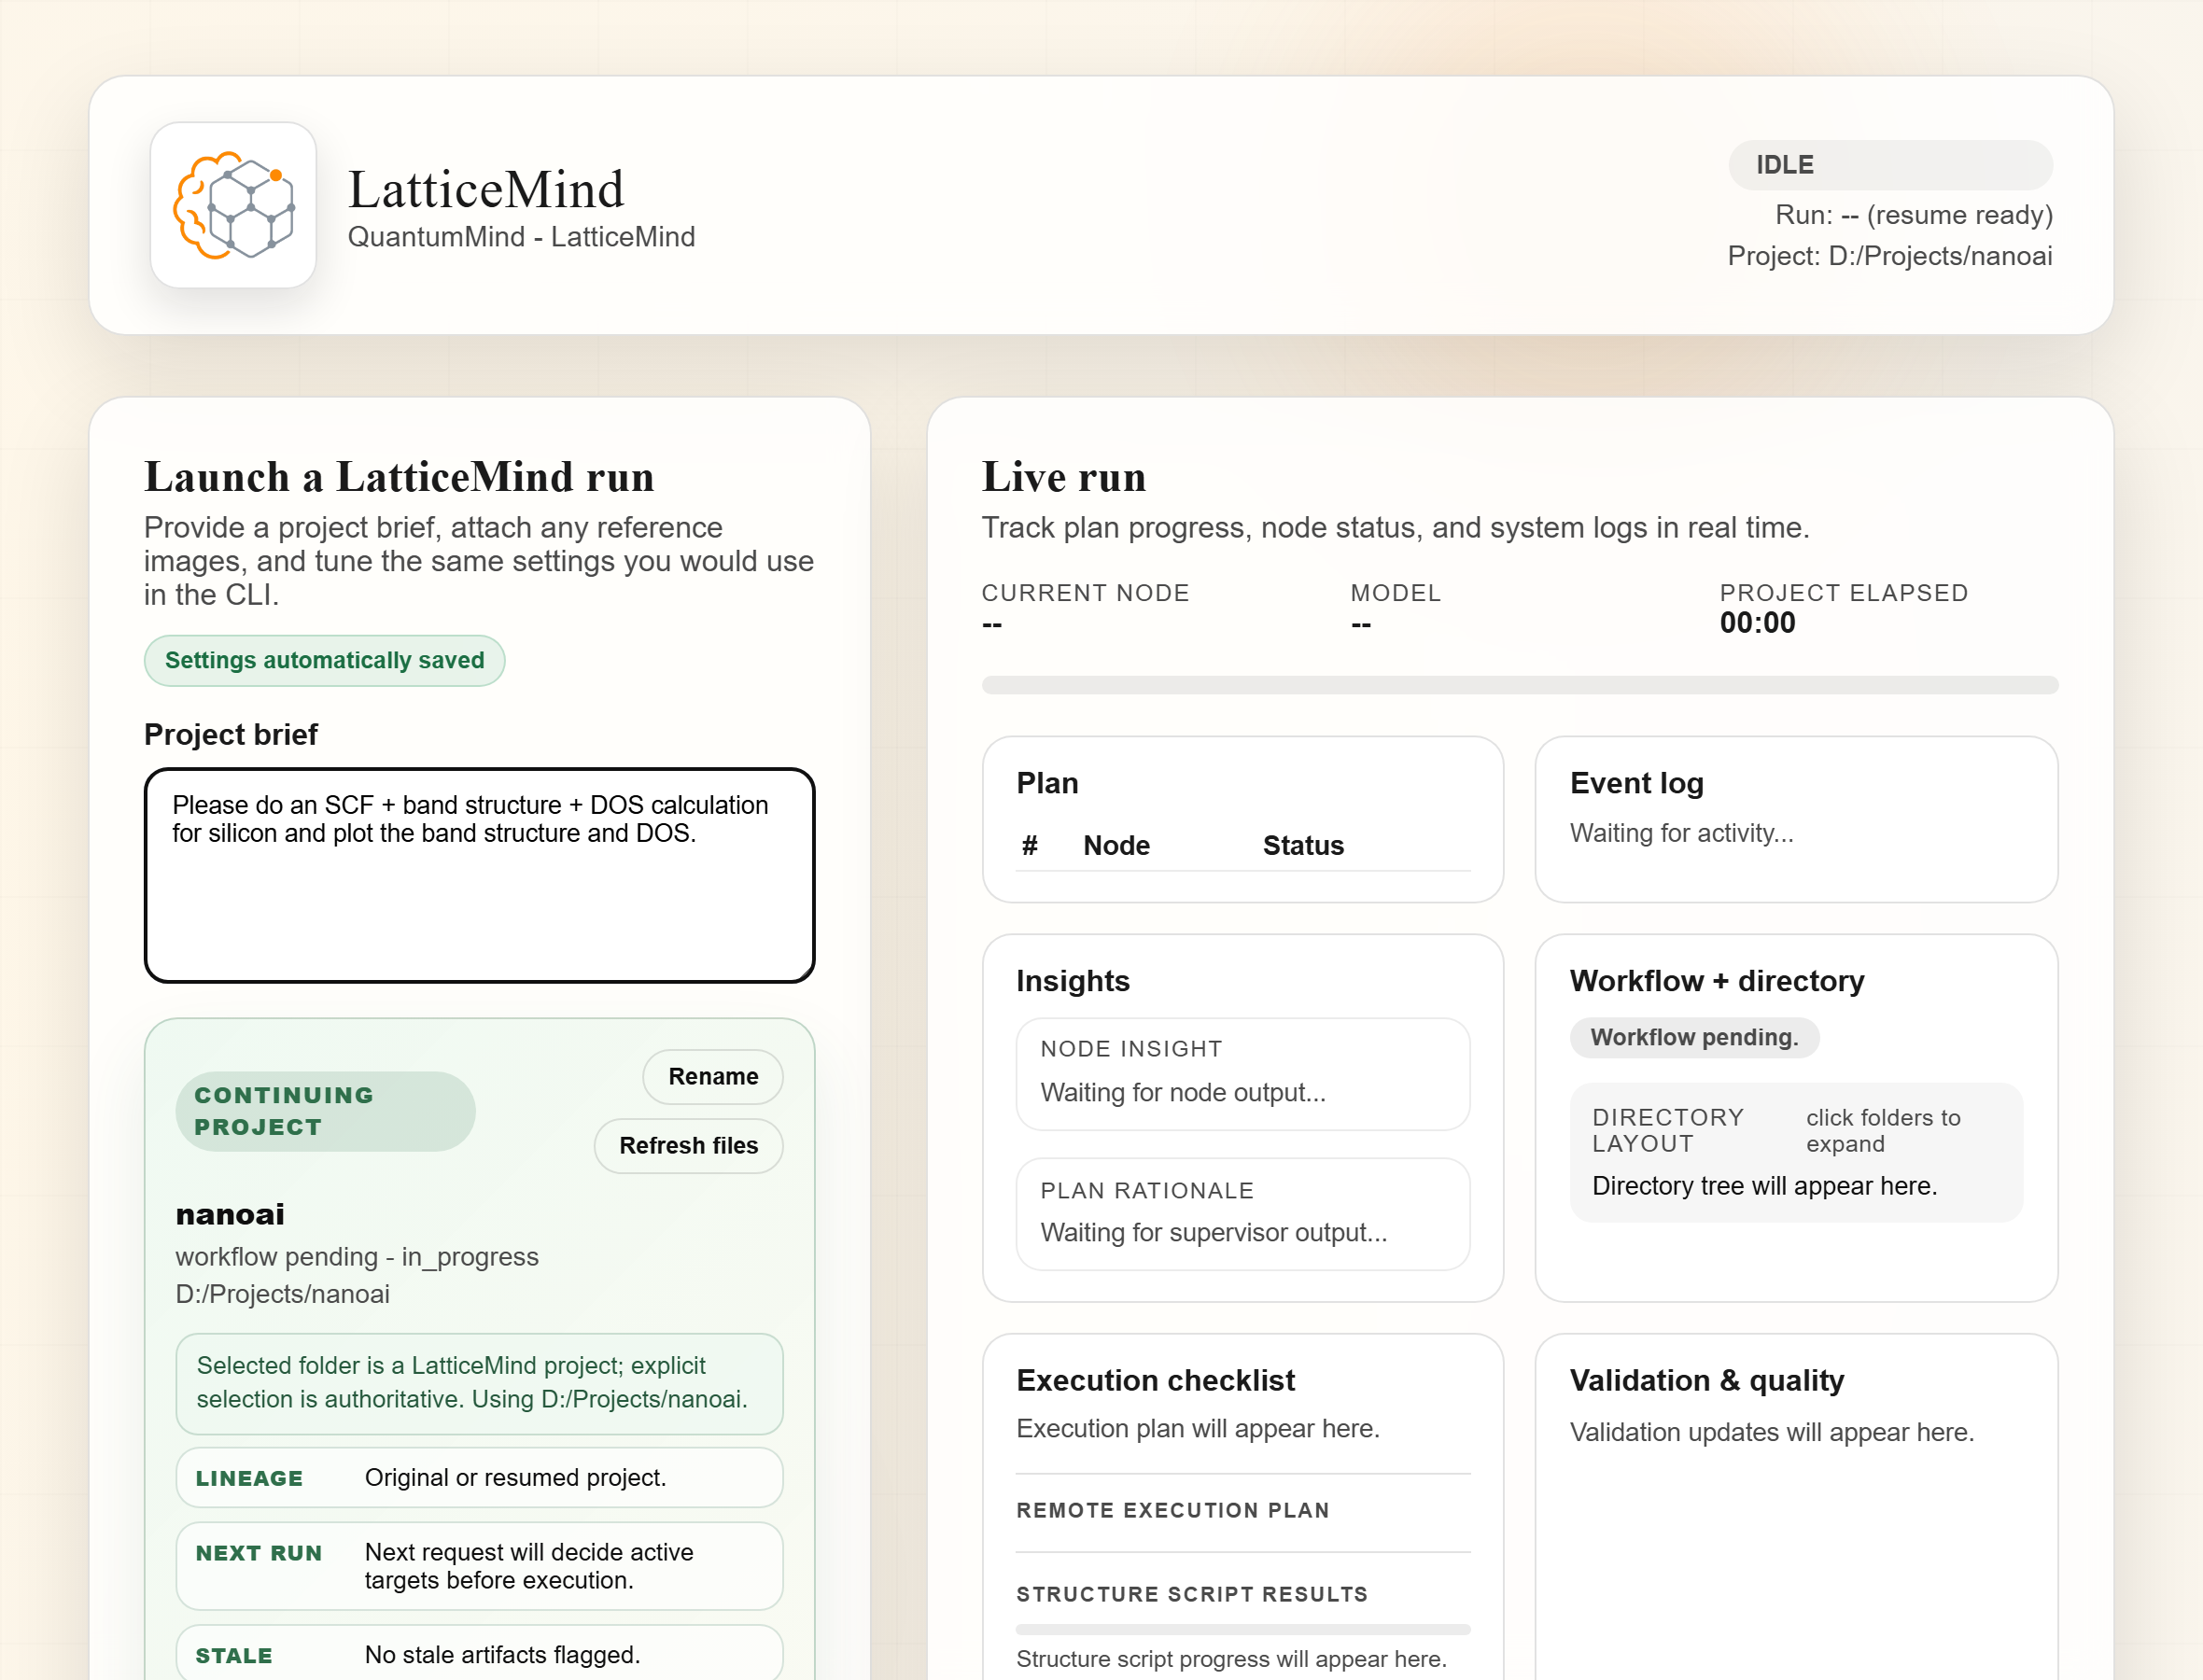
Fig. 3.4.1 The same first project in the Web UI: the brief on the left, live progress on the right.
3.5. Step 5 — See your results
When it finishes, LatticeMind has produced plots, extracted quantities, and a report:
/analysis     # extracted values: total energy, band gap, electron count
/plots        # the generated figures
/outputs      # everything, including the report
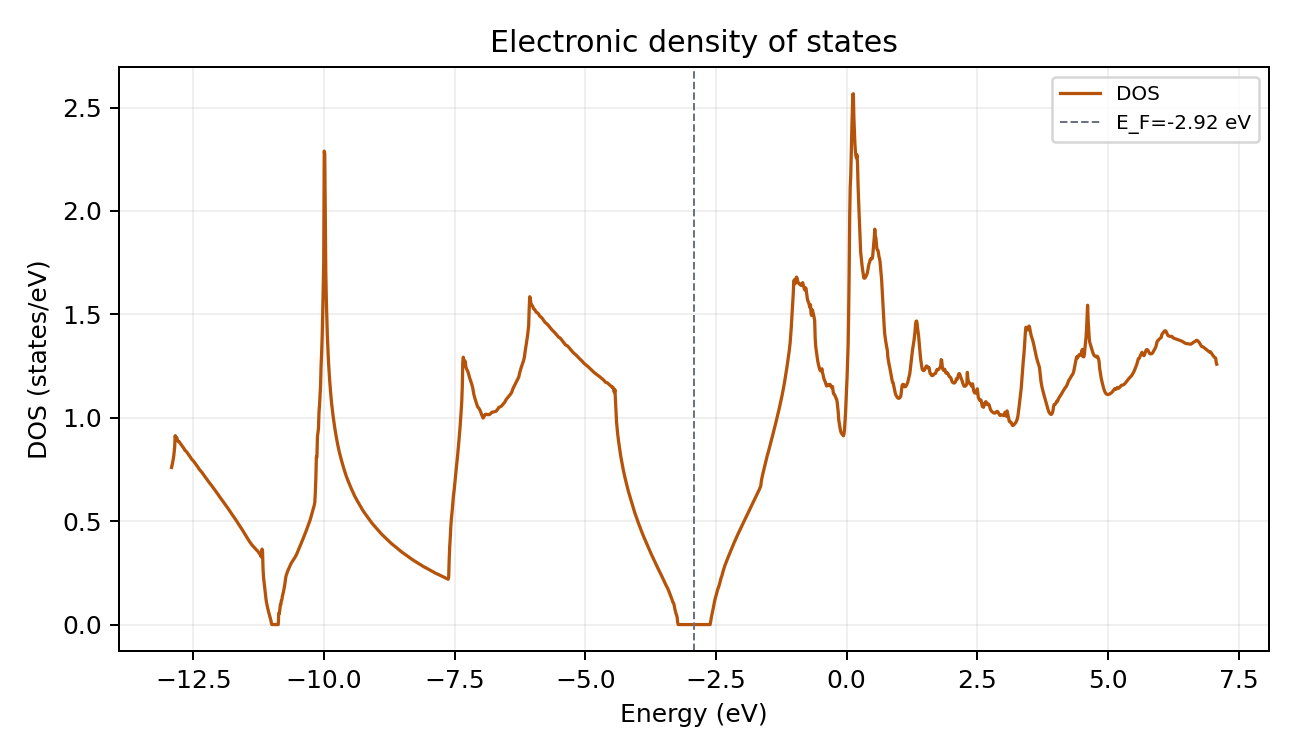
Fig. 3.5.1 Your first result: the silicon density of states, with the Fermi level in the gap. (See Silicon: SCF, band structure & DOS for the band structure and the numbers.)
Everything lives in a self-contained project folder you can revisit, share, or resume — see Projects & the workspace.
3.6. What next?
Learn what happened under the hood: How LatticeMind works.
Try more materials and calculation types: Basic tutorials.
Scale up to a cluster: Running on an HPC cluster.
Tip
Stuck at any point? Type /why for an explanation of the current state, or
/tips for suggested next actions.