7. The Web UI tour
The Web UI gives you the full LatticeMind workflow in your browser: describe a project, tune settings, launch, and watch it run in real time. Launch it with:
latticemind-web # opens http://127.0.0.1:7865
7.1. The Web UI dashboard at a glance
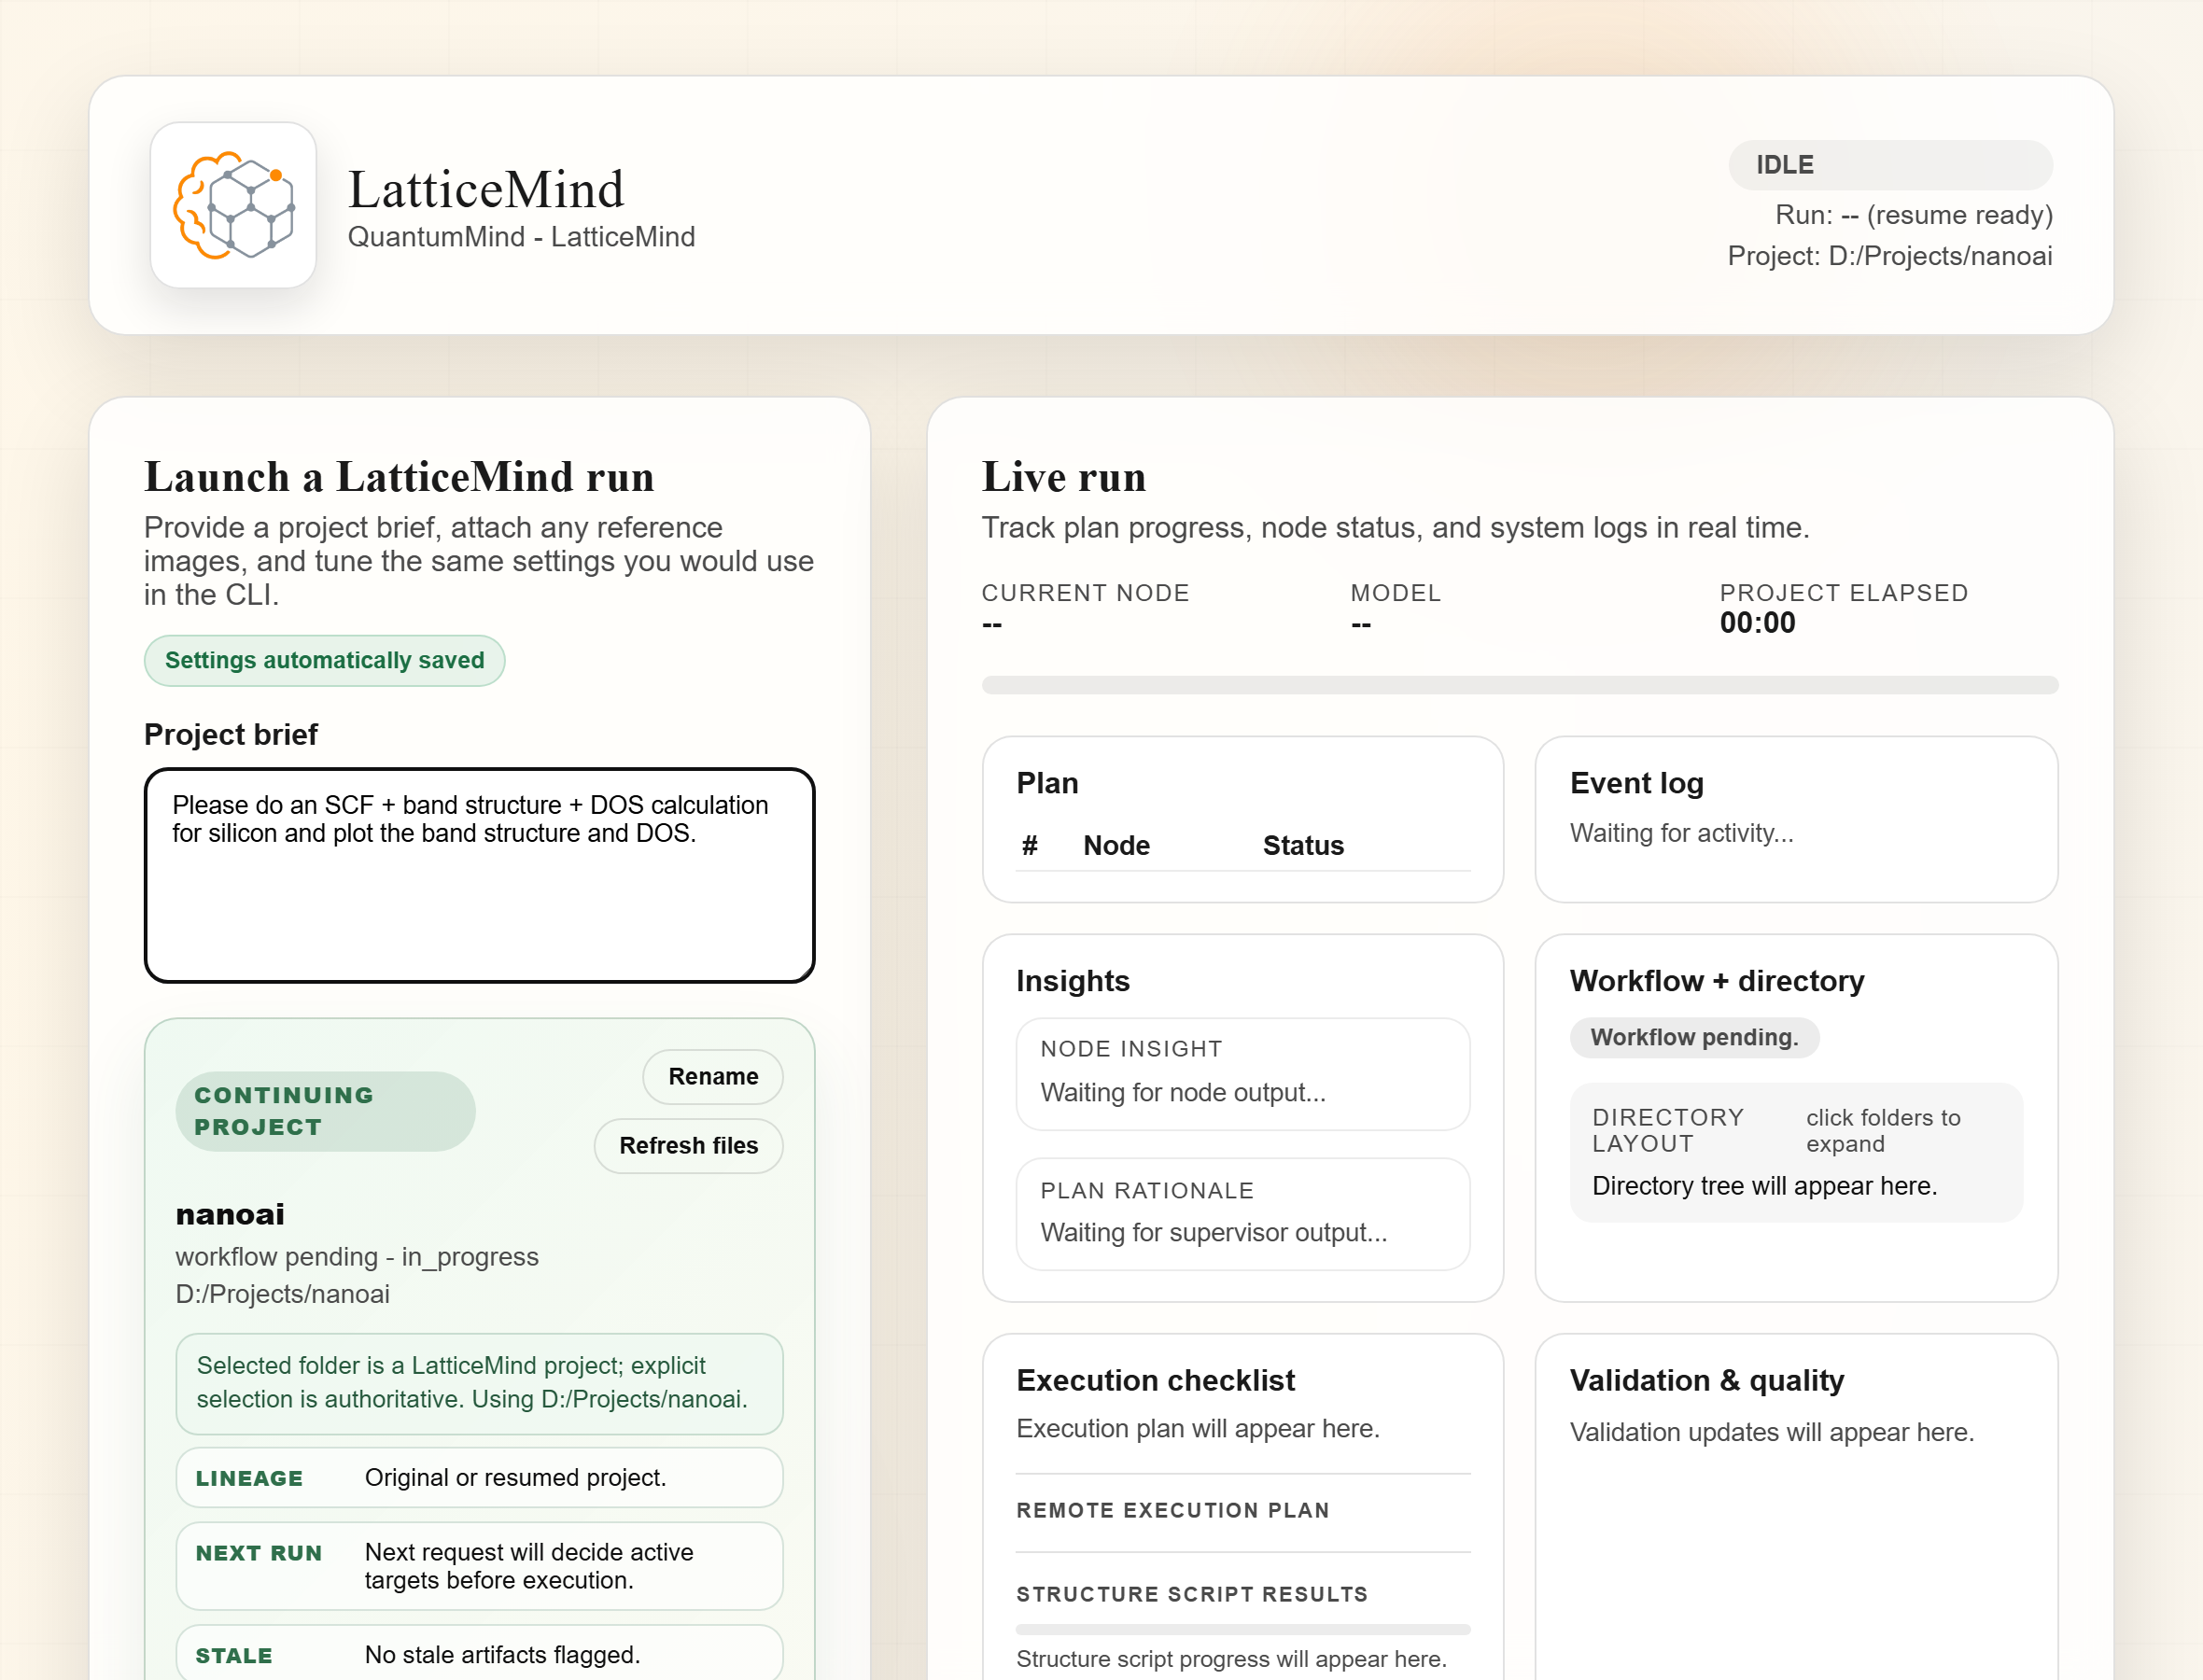
Fig. 7.1.1 The LatticeMind Web UI dashboard. Left: the run panel — status, project brief, and the active project. Right: the Live run panel — plan progress, event log, insights, workflow/directory tree, execution checklist, and validation.
Across the top of the run panel you always see the current status (IDLE,
running, etc.), the Run id, and the active Project path.
7.2. Launching a run
Type your request in the Project brief box — the same plain-language prompt you would use in the CLI (“Do an SCF, band structure, and DOS calculation for silicon, and plot the band structure and DOS.”).
Optionally attach reference images or documents.
Tune settings (below) if you need to.
Click Run.
The active project card shows whether you are starting fresh or Continuing an existing project, with Rename and Refresh files controls.
7.3. Settings
All the settings you would set in the CLI or .env are here, saved
automatically as you change them (“Settings automatically saved”):
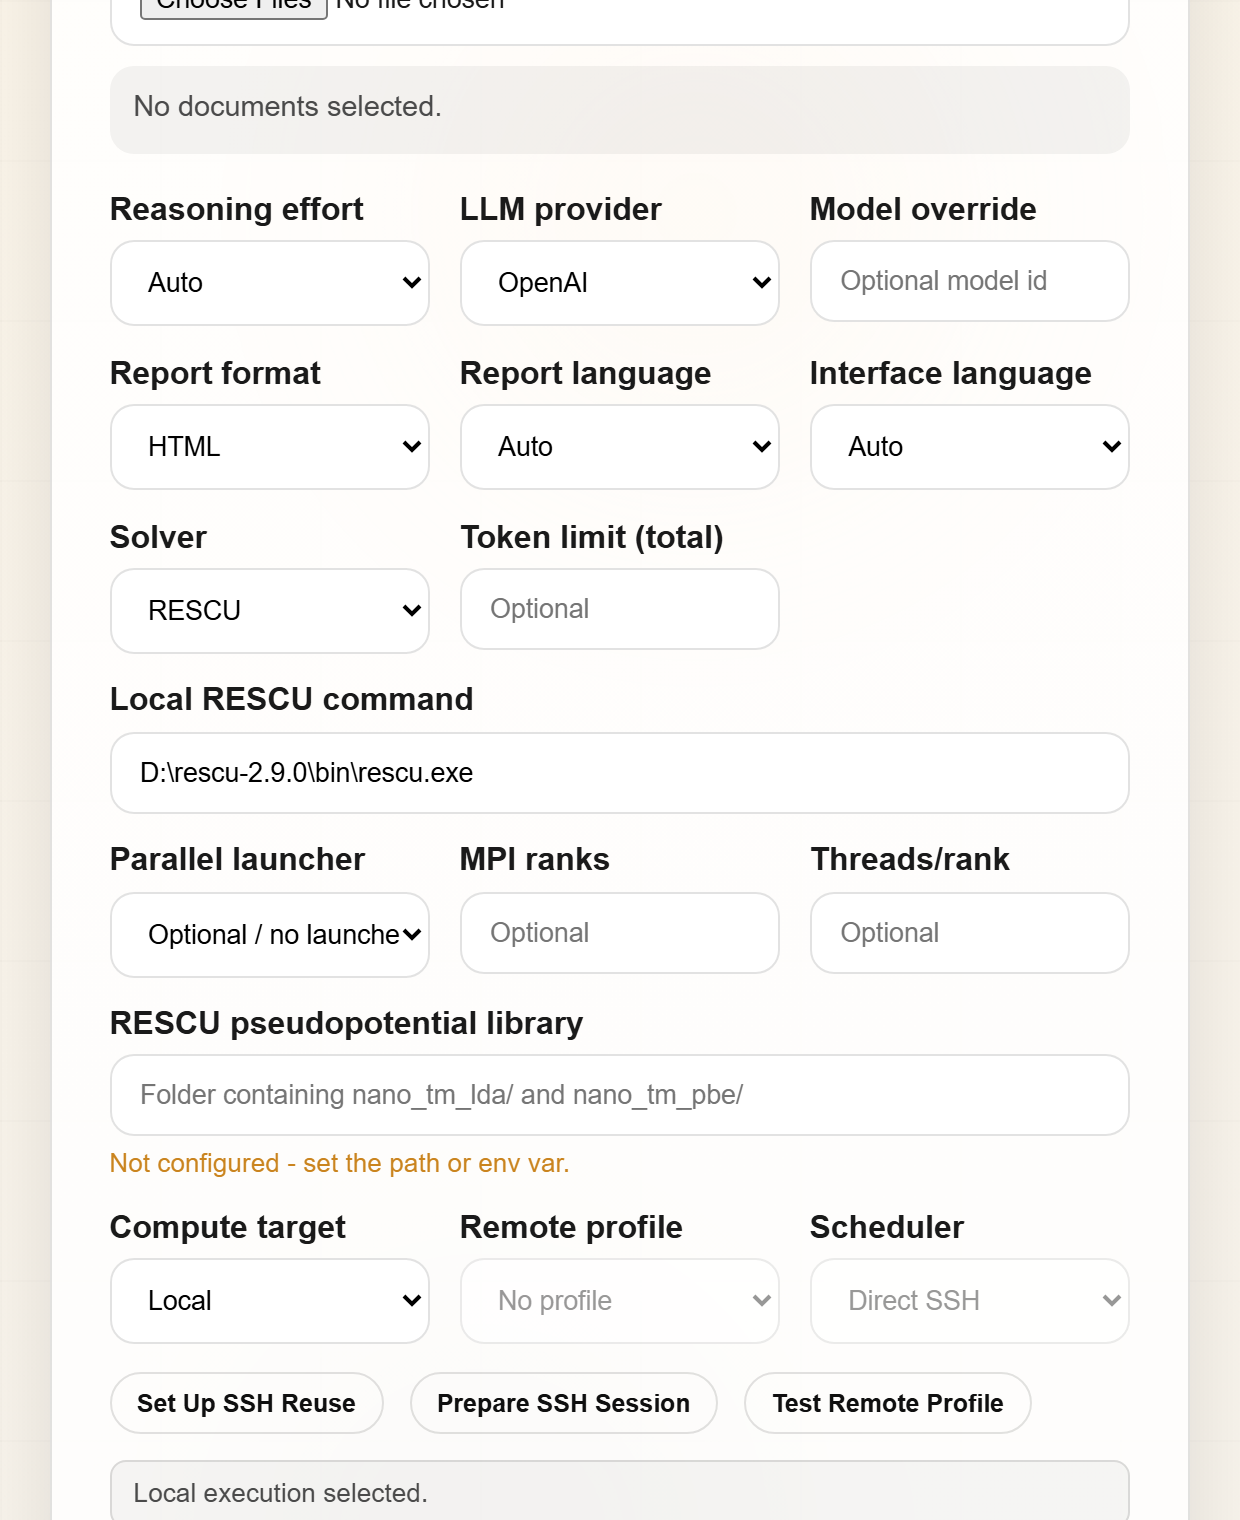
Fig. 7.3.1 The settings panel, with RESCU selected as the solver.
Control |
What it sets |
|---|---|
Reasoning effort |
How hard the AI thinks ( |
LLM provider / Model override |
The AI backend and an optional specific model id. |
Report format / Report language / Interface language |
HTML or off; report and UI language (auto/en/fr/zh). |
Solver |
RESCU, NanoDCAL, or VASP (preview). |
Local RESCU command |
Path to your solver executable (e.g. |
Parallel launcher / MPI ranks / Threads/rank |
Local and remote parallel execution. |
RESCU pseudopotential library |
Optional override for the bundled pseudopotentials. |
Compute target / Remote profile / Scheduler |
Local, remote SSH, or Slurm — with Set Up SSH Reuse, Prepare SSH Session, and Test Remote Profile buttons (see Remote & HPC execution). |
7.4. Execution controls
Below the settings are the execution toggles and the action buttons:
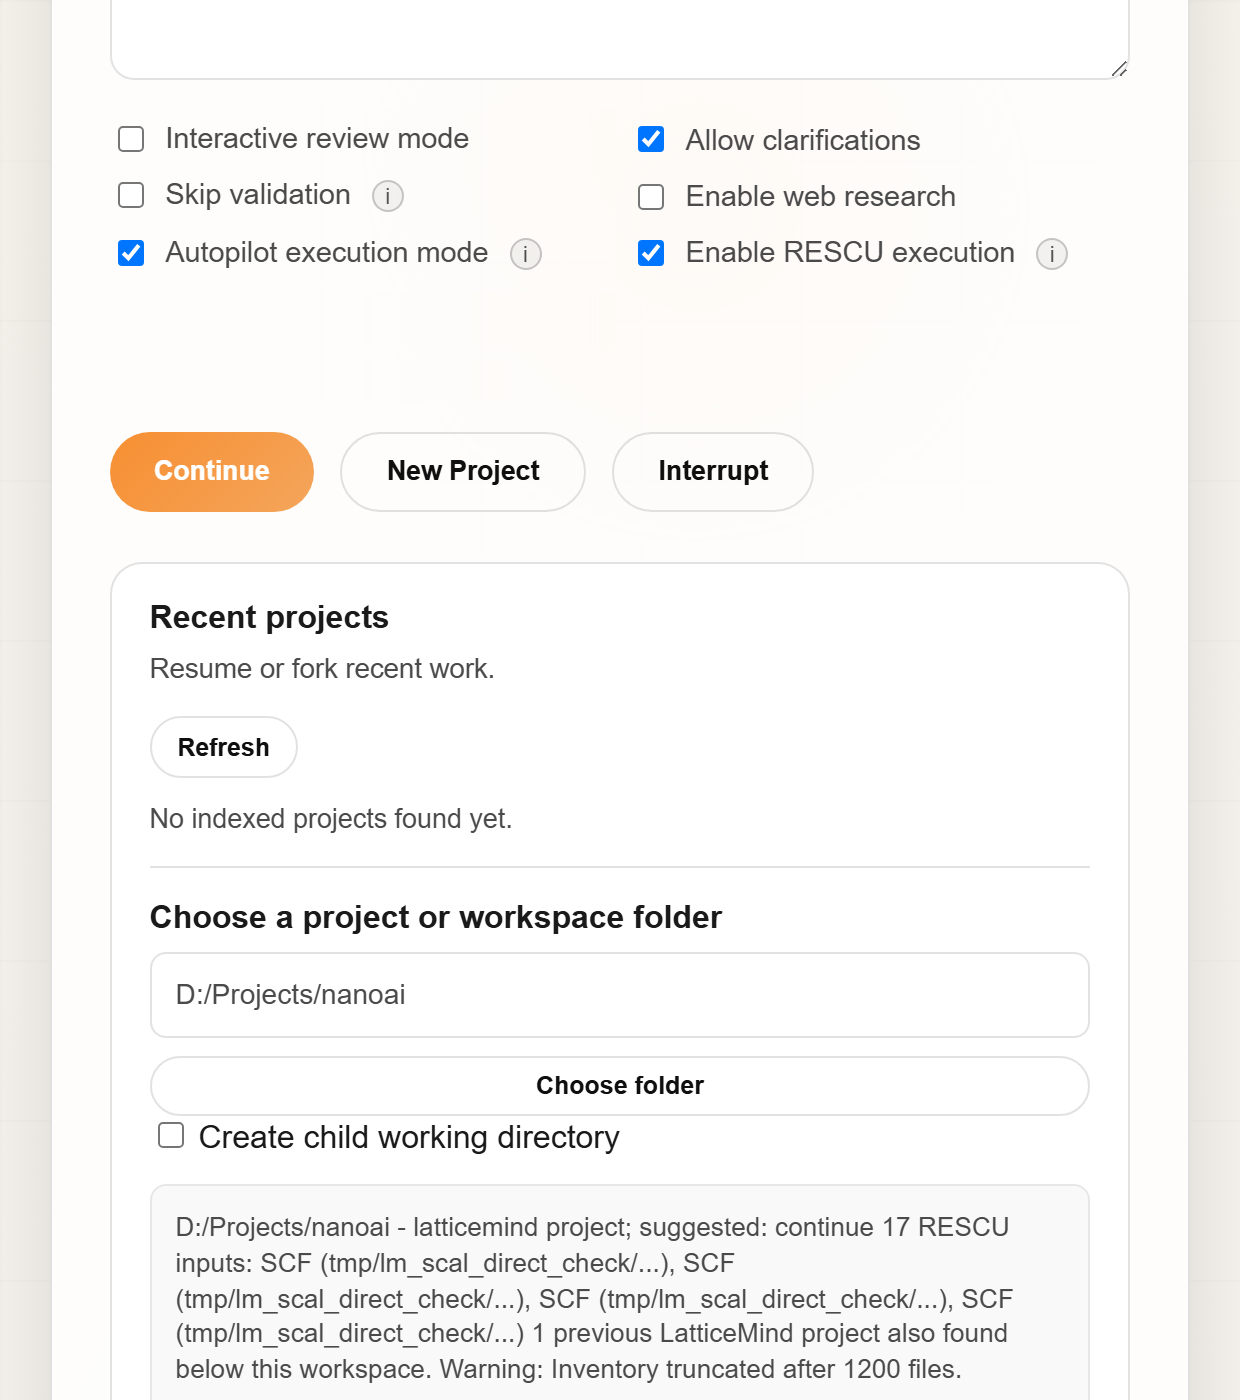
Fig. 7.4.1 Execution toggles and the run controls. Enable solver execution and Approve for me are the two you will use most.
Allow clarifications lets LatticeMind ask you a question when a request is ambiguous (on by default).
Enable web research lets the model run web searches through your LLM provider’s built-in search tool when it needs outside information. It is off by default; when on, your search queries are sent to your provider (see What LatticeMind sends).
Skip validation turns off the launch gate (not recommended).
Enable solver execution allows the calculation to actually run; leave it off to only generate and validate inputs.
Approve for me assesses each pending action and approves bounded low-risk work; anything else still asks (the CLI’s
/approve-for-me on).The buttons — Run / Continue, New Project, and Interrupt — start, restart, or stop a run.
7.5. Watching a run
The Live run panel (right side of Fig. 7.1.1) updates in real time as LatticeMind works:
Current node, Model, and Project elapsed time.
A Plan table showing each calculation and its status.
An Event log of everything happening.
Insights (node and plan rationale), the Workflow + directory tree, the Execution checklist, and Validation & quality updates.
Tokens & budget and Computation cost panels.
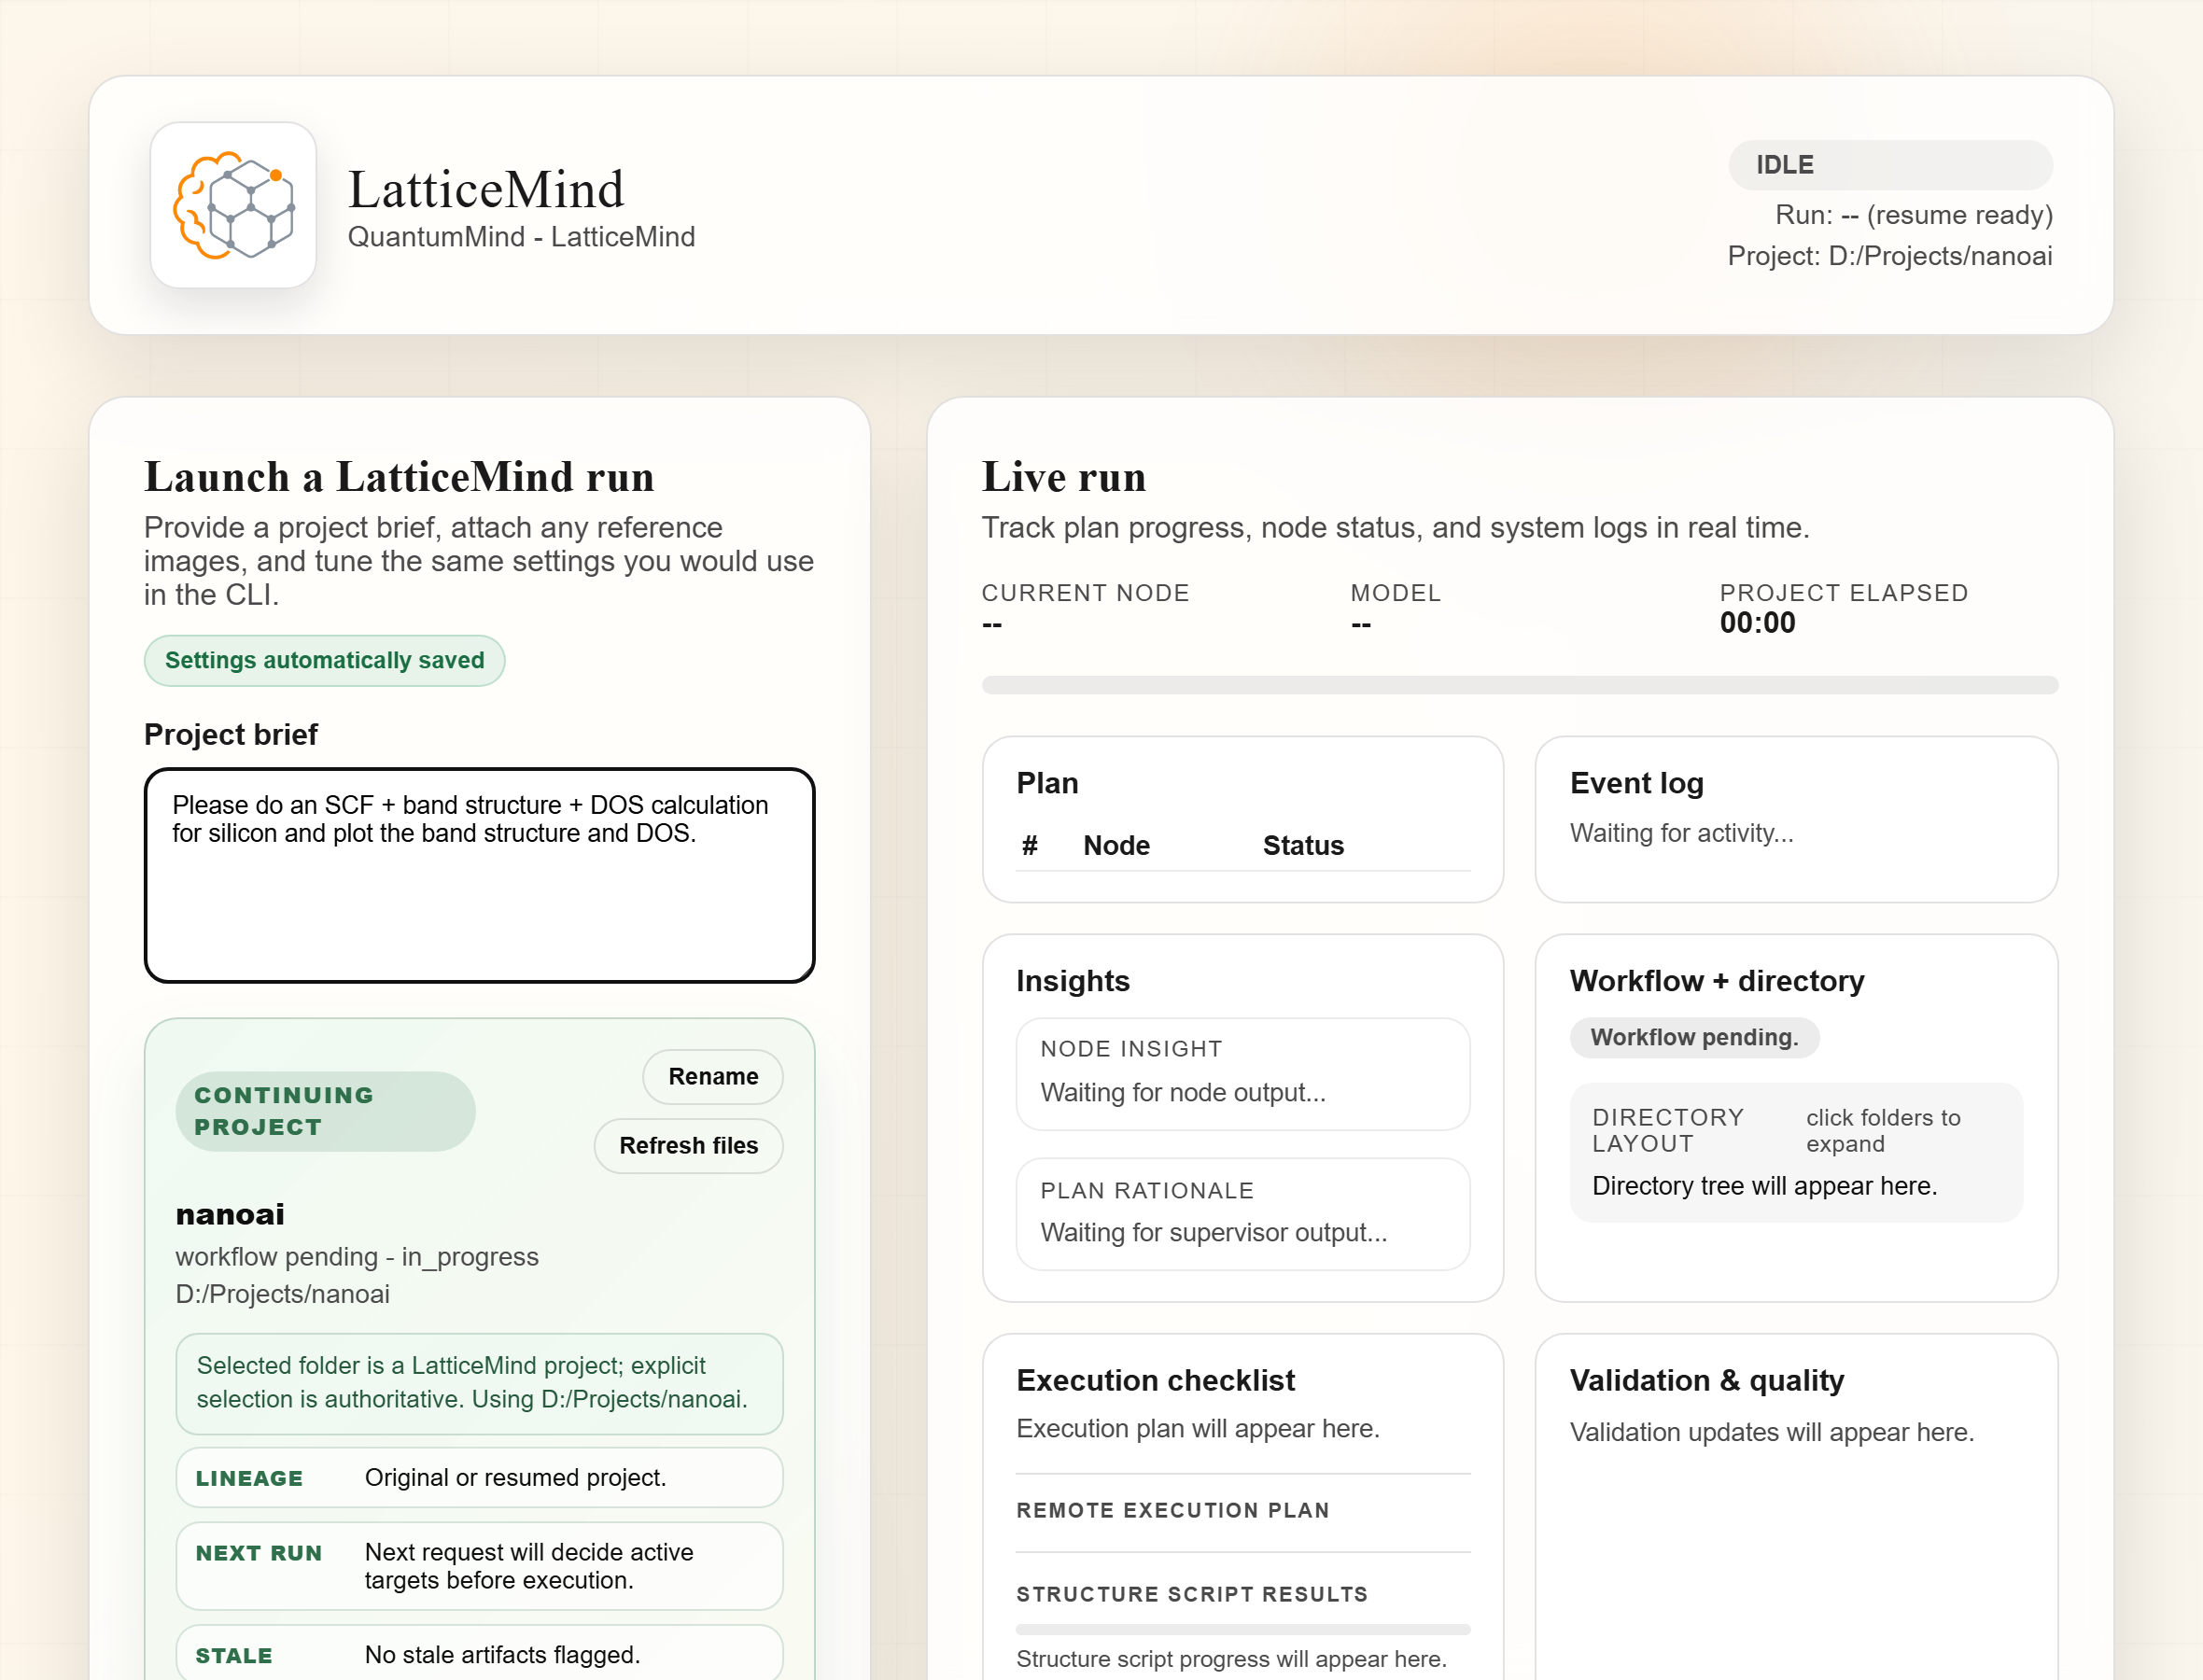
Fig. 7.5.1 The Web UI dashboard with a project brief entered and a continuing project selected, before the run starts. The Live run panel on the right fills in as the run proceeds: plan, event log, insights, workflow and directory, execution checklist, and validation.
7.6. Recent projects & folders
The Recent projects panel lists indexed projects to Resume or fork. The
Choose a project or workspace folder control lets you point LatticeMind at
an existing folder and adopt it as the active project (the browser equivalent of
/attach). The Project subdirectory checkbox beside it decides whether a
new run works directly in that folder or in a fresh project subdirectory under
its latticemind_outputs/ (the CLI’s /subdir); home, root, system, and
software folders always get a subdirectory. See Projects & the workspace.
7.7. Results
When a run finishes, the generated plots and the report appear in the project, and the raw files are on disk in the project folder. See Projects & the workspace for the layout, and Silicon: SCF, band structure & DOS for a full worked example.