4.1. User-defined k-point lines
In the previous example, the k-point line is defined using conventional
high-symmetry point labels. This is not always practical, one may not
know the label of each high-symmetry point or use a different
convention. The keyword kpoint.sympoints therefore accepts
(fractional) k-point coordinates in place of labels. For example, in the
previous example, one could have used
kpoint.sympoints = {[1/2 1/2 1/2],[0.0 0.0 0.0],[1/2 0.0 1/2],[1/2 1/4 3/4],[3/8 3/8 3/4]};
or even
kpoint.sympoints = {'L',[0.0 0.0 0.0],'X',[1/2 1/4 3/4],'K'};
The RESCU plotting routine will show a ! character for every tick
mark corresponding to a coordinate-defined checkpoint. You may fix the
label using the following command
set(gca,'XTickLabel',{'L','G','X','W','K'});
The last argument should contain the label for all tick marks.
4.2. Standard k-point lines
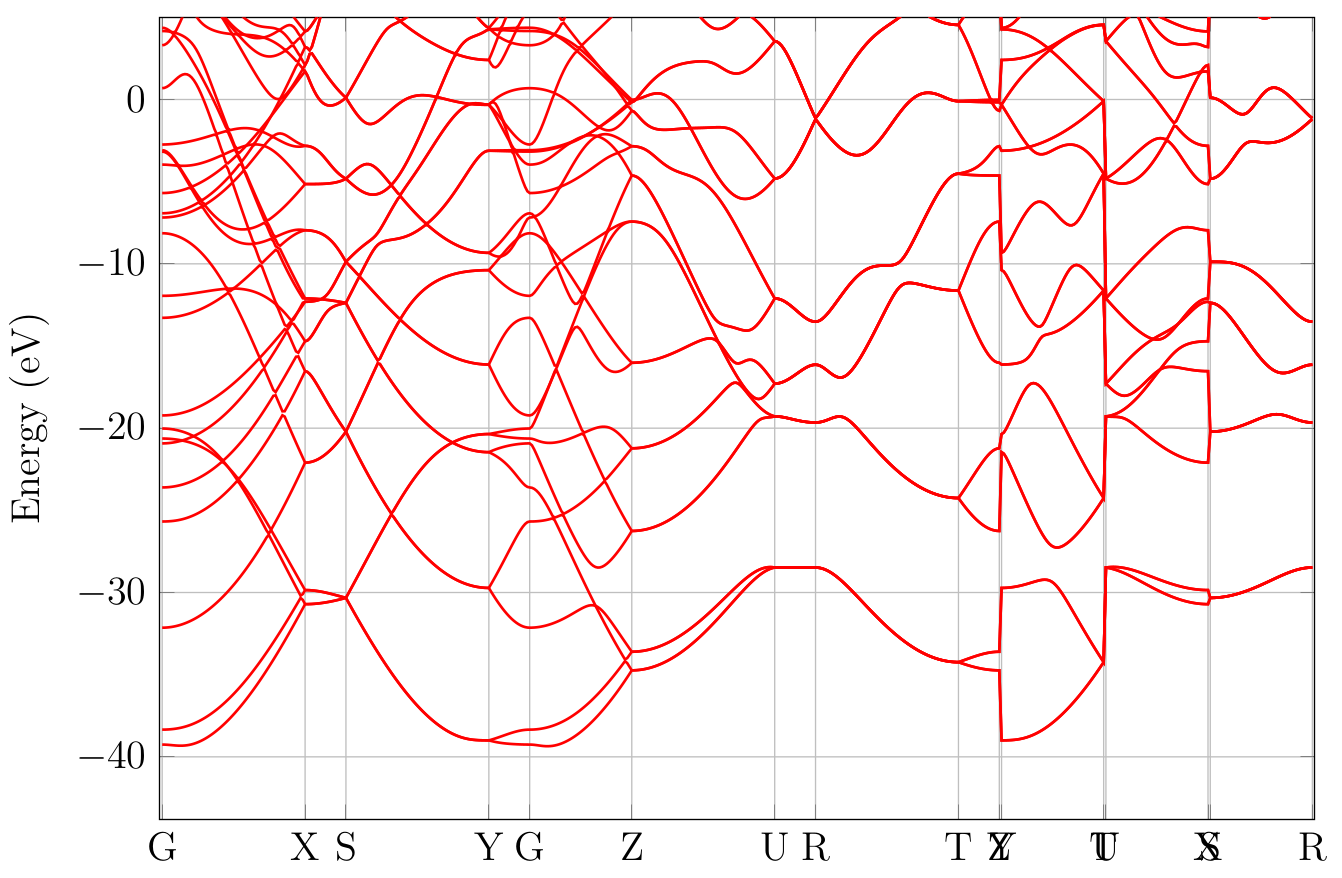
Fig. 4.2.1 Phosphorus band structure.
In the previous example, the Bravais lattice is recognized to be a face-centered cubic lattice (FCC). High symmetry k-point are labelled conventionally; we follow [SC10], so user may turn to it for additional details. Symmetric points and pre-defined lines spanning irreducible Brillouin zone of most lattices have been implemented. It is often not possible to follow a continuous line, and hence most automatic lines consist of multiple segments. These can be quite long, and hence the user should choose the number of k-points accordingly. An example of an automatically generated k-line for tetragonal bulk phosphorus is shown in Fig. 4.2.1. Definitions and details are given in Bravais lattices and irreducible Brillouin zones.
Wahyu Setyawan and Stefano Curtarolo. High-throughput electronic band structure calculations: Challenges and tools. Computational Materials Science 49.2 (2010), pp. 299 –312.